Title Dashboards: TV shows and films at a glance
When you browse Home, review Charts or use Search, clicking any title takes you to a Dashboard.
Dashboards combine topline information about TV shows and movies with key performance data and visuals. Use them to help contextualize streaming performance over time, by episode or by total views.
There are two Title Dashboard types: Movie Dashboards and TV Show Dashboards. A third category, Streaming Service Dashboards, can be viewed by selecting a Streamer from the sidebar menu.
Anatomy of an SV(M) Dashboard
SV(M) Dashboards for movies and TV shows display the same essential information. Some categories apply only to TV Show Dashboards (see Item 6).
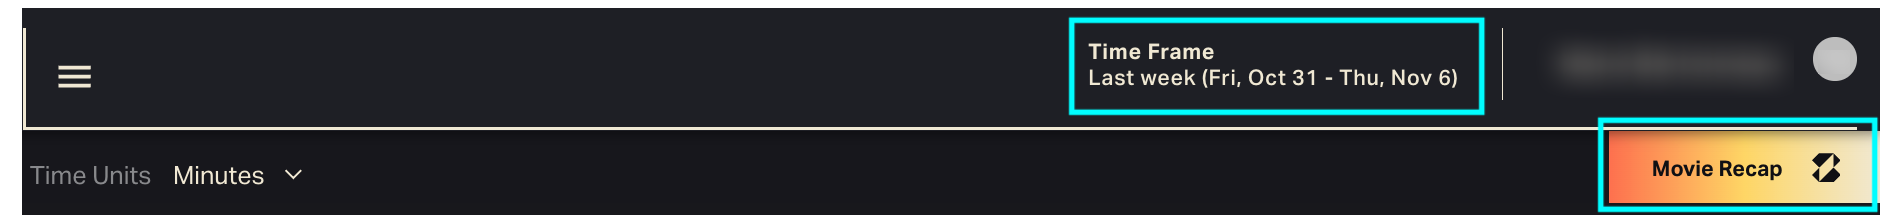
Use the top menu bar to change the Time Frame and/or get a summary of the title's performance from Lumi, the AI-powered SV(M) assistant.
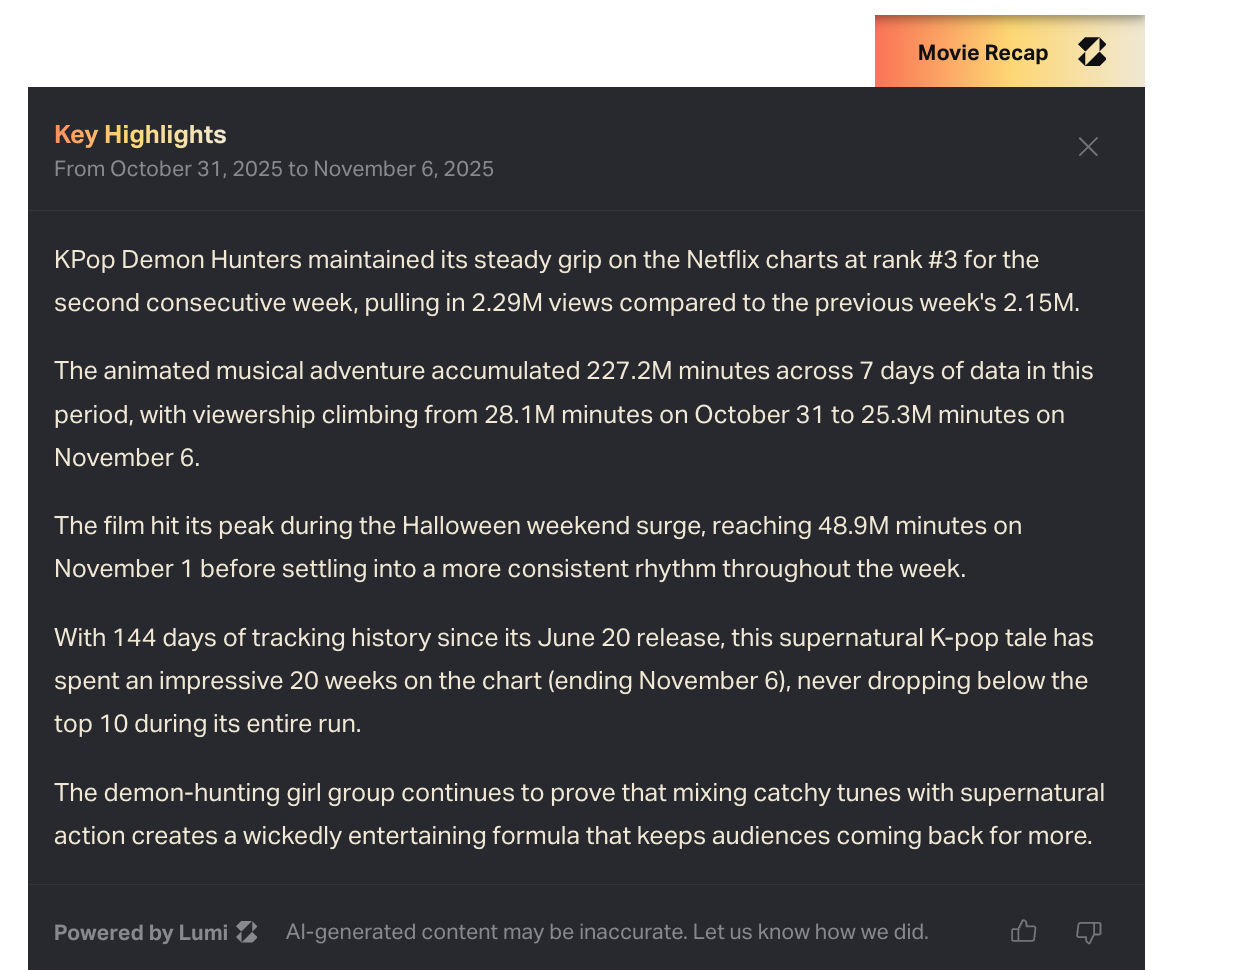
Movie or TV Show Recap: Highlights from Lumi
Click Movie Recap or TV Show Recap at top right to see title-level performance insights from Lumi, our AI-powered analytics assistant.
Lumi will generate a unique rundown of standout numbers, trends and insights for your selected time frame.
Overview and details
Beneath the menu bar, the top of every Dashboard lists key metadata. Some fields may be truncated; resize your browser window or click MORE to expand the overview if needed.
TV Dashboards: Select a SeasonSV(M) tracks TV by season. Every season of a show is treated as a unique title with its own Dashboard. TV Dashboards include combined viewing metrics for the season as well as episode-level data.TV Dashboards list the season number just below the show title. Choose a different season from the dropdown menu.See combined show data with Series DashboardsFor shows with multiple seasons, select All from the season dropdown to see a combined Series Dashboard.Series Dashboards aggregate viewership at the season level. Use them to analyze viewership by season, rather than by episode.Scroll to SEASONS to see all seasons listed by activity, just like episodes on a single-season TV Dashboard.Film and TV metadata categoriesEntity type
Movie or TV Show
Season # (TV only)
TV Shows display the season number below the title. SV(M) treats each season as one title. Use the Seasons dropdown to visit another season’s Dashboard (or choose All to see the Series Dashboard).
Creator
Director (Movie) or Creator/Showrunner (TV Show)
Overview
Logline and/or synopsis of the title.
Release Date
For streaming originals, the release date reflects the streaming premiere date. Non-streaming originals may display a theatrical release date or linear TV premiere date.
Duration
For TV shows, this is the sum of the length of all episodes in the season. TV series and season duration is always fixed as of the current date; it doesn’t change based on the number of episodes available in the selected time frame.
Available Platforms
Streaming service(s) where the title can be viewed
Studio
All companies that participated in production (financing, production, post-production, distribution, etc.)
Genre
All applicable genres
Export the entire DashboardExport all viewership data and metadata for a title within your selected time period by clicking the Download button at top right.Dashboard data will download automatically in Excel format. Your exported Excel file will have three sheets (see bottom row of tabs).Metadata lists all the title metadata at the top of the Dashboard, plus the date range covered in the export. Trends Data breaks out daily viewership (Minutes Watched, Hours Watched and Views) by day or week. Demographics lists demo breakouts for the title during your time frame.Images, graph visualizations and episode-level data are not included in Dashboard exports.
Performance snapshot
The second row summarizes key performance indicators (KPIs): Time Watched (Minutes or Hours depending on your unit selection) and Total Views / Season Views.
Total Views / Episode Views / Season ViewsThe Views metric is an estimate of how many times a title was viewed in its entirety within a given time frame. Total Views is not a lifetime total or total to date; it's a total for your selected date range.
For movies, we calculate Total Views by dividing minutes watched by the runtime (ex. a two-hour movie watched for 40 million minutes = 20 million views).Episode Views are calculated the same way: viewership in minutes divided by episode runtime in minutes.Season Views are more complex to estimate: How many times were all available episodes of a TV season watched in a given time frame?
To do this, we don't simply sum Episode Views. Instead, we divide season minutes watched within the time frame by the duration (in minutes) of the season to date.For example, if 5 episodes totaling 140 minutes were available to stream during your selected week, we divide Minutes Watched by that combined duration of 140 minutes.Series ViewsSeries Dashboards display combined data for all available seasons of a show. The SERIES VIEWS metric is the sum of all Season Views for the time frame.ATD and % ChangeATD
Activity to Date (ATD) displays the cumulative total activity as of your selected time frame. If you set Time Frame to a past week, ATD will represent total activity through that week, not up to the present day.
% Change
The "# DAYS" figure calculates a % change from the period preceding your selected time frame. if applicable.
3. Demographic information
The third row shows two demographic breakouts: Gender and Age.
4. Data controls and view options
By default, SV(M) Dashboards show streaming results from the week in progress (Fri-Thu) in increments of Minutes Watched. Change Time Frame and Time Units to update data displays on the entire Dashboard.
See Time Frame selectionOpen the Time Frame menu from the top menu bar and choose Current Week, Last Week, Year to Date, First 12 Weeks of Activity, or Custom.
First 7 Days / 20 Days / 12 Weeks of Activity sets a contextual window starting with the first week of available data. For titles that debuted before 2022, the “first ___ weeks” represents the first span for which SV(M) has tracking data. Selecting this option for pre-2022 titles may default to the first week(s) of 2022, though it may also display a later period depending on when SV(M) first began tracking the title.Use the Time Frame calendar to define your own date range. Chart weeks are numbered to the left of the calendar; use this column to select a range of one or more weeks.
SV(M) chart weeks are Fri-Thu.Time zone: UTCAll SV(M) dates begin at 12:00 a.m. UTC. Daily streaming viewership is counted from 12:00 a.m. to 11:59 p.m. UTC on a given date irrespective of the viewer’s time zone or the title’s release location.
5. Trends
The Trends pane shows daily or weekly viewing activity within your selected time frame. Toggle between Daily or Weekly Time Views at top left.
Hover over a bar to see full details for that day or week. Zoom in on a chart area by holding down and dragging your cursor to highlight the section you want to expand; click Reset zoom to go back.
Export Trend dataClick the ... icon at top right to export Trends in CSV or Excel format. A Trend export downloads in grid format with column for Week, Day, Minutes Watched and Hours Watched.
6. Episode and season information (TV)
TV Show Dashboards contain additional displays that break down viewing activity by episode or season.
Episodes
See viewing activity for each available episode of a season during the selected time frame.
The list at left ranks episodes by viewership; it also lists Episode Views (Min Watched / Duration).On the right, a pie chart shows the per-episode share of total views in your selected date range.Episode TrendsThe Episode Trends display plots episodic viewing data on a line graph. The X-axis represents the time frame; the Y-axis shows viewing numbers.Episodes are listed and color-coded below.
Each point on a line represents one day or one week. Switch between Daily and Weekly views to see more or less detailed line plotting.Select line or bar graphs / Hover for detailsSwitch to a bar chart instead of a line graph using the button at top right.Bar clusters represent days or weeks. Each bar within a cluster represents one episode. Hover over a bar to see details; this also highlights that same episode for other dates.
Seasons / Season TrendsTV Series Dashboards treat entire seasons the same way that season-level TV Dashboards treat episodes. Use them to compare activity among seasons.
Season Comparison: Normalized season trendsOn a Series Dashboard (TV Show Dashboard > Season: All), the Season Comparison chart offers a normalized view of season performance in the first few weeks of release.Set Time Frame to First 12 Weeks of Activity to change SEASON TRENDS to SEASON COMPARISON and compare seasons.Note that Lumi's TV Show Recap (top right, grayed out) is not available for First 12 Weeks of Activity at the series level.
7. Related Content
Browse related titles based on genre and distributor.
Title Dashboards FAQ
Is Release Date the original release date, or the streaming date?
For streaming originals, the release date listed on a Dashboard reflects the streaming premiere date. Non-streaming originals may display a theatrical release or linear TV premiere date.
Why is viewership low for the First ___ Weeks of an older title?
SV(M) only tracks viewership from 2022 at the earliest. If you add a pre-2022 title to your Comparison, you’ll see viewership for the first few weeks of 2022 instead of the first few weeks of release.
For example, selecting weeks 1-26 for a 2019 TV season won’t display viewership from 2019. Instead, you’ll see how many people happened to watch that season in weeks 1-26 of 2022.
We do not track historical modeled viewership before 2022.
What’s the “previous period?”
On a Title Dashboard, the Minutes Watched pane displays increase or decrease compared to the previous period which is always the week immediately prior to the selected week.
Previous period comparisons are only available for time frames of one week at a time.
What’s Activity to Date?
In SV(M), Activity to Date (ATD) is the total cumulative activity for a title. ATD starts with the earliest date for which we have data for a title and extends to your selected chart week/date range.
If you select a week or date range in the past, the ATD total is only up to that date, not the present day.
How far back does SV(M) ATD data go?
SV(M) tracks modeled streaming activity from Week 1 of 2022 onward.
For some titles, including library titles, SV(M) began tracking viewership after Week 1 2022. In those cases, ATD data starts from the week with available viewing figures.
Why doesn’t Week 1 start on 1/1? / How are week #s assigned in the calendar?
SV(M) designates the first full chart week of the year as Week 1. There are no partial weeks. It’s possible for the first chart week of January to start a few days before or after 1/1. In 2025, Week 1 ran from 1/3-1/9.
Week numbers for each year are listed in the leftmost column of the Calendar tool. Open the Time Frame menu to check the week # for a specific date.
What time zone do you use to determine dates?
All SV(M) dates begin at 12:00 a.m. UTC. Daily streaming viewership is counted from 12:00 a.m. to 11:59 p.m UTC.
Can I see daily streaming figures in a different time zone?
No. All SV(M) dates are based on the UTC time zone, regardless of viewing location.
What is UTC?
We use UTC (Coordinated Universal Time, EST+5) for all day, date and time demarcation irrespective of viewing time zone, title release location or SV(M) user location. UTC is a universal time standard used around the world.
Is TV Duration for the whole show/season, or for the date range?
TV Duration metadata is for the entire show or season as of today’s date. It can increase when more episodes are released, but it doesn’t change based on your Time Frame selection. A season of a TV drama with 10 released episodes will continue to list a duration of 450 minutes even if you change Time Frame to a week when only 2 episodes were available to stream.
More to know
SV(M) User FAQs: Help with film and TV streaming tools
Comparison: Head-to-head streaming performance
Streamers: Film and TV provider information
SV(M) Ranking Report: Sort and export top titles
Read next: SV(M) Charts: Top streaming movies and TV shows
Related Articles
SV(M) Charts: Streaming film and TV rankings
Luminate publishes official streaming film and TV charts based on weekly minutes watched. Go to Charts to see the latest rankings and browse past weeks. Navigation Open Charts in the SV(M) sidebar menu and choose Movies or TV. Back to User Guide The ...SV(M) Home: Trending titles and current charts
Welcome home! Whether you access SV(M) from the URL svm.luminatedata.com or via your Luminate user portal, you’ll land on your account’s Home page. Navigation Open Home from the SV(M) sidebar menu. Back to User Guide Preview this week’s charts The ...Welcome to SV(M): Streaming Viewership, Modeled
Welcome to Luminate Streaming Viewership (M), your source for film and TV streaming measurement and analytics. Designed and operated by Luminate, the entertainment industry’s trusted third party of record, SV(M) ingests data from multiple sources and ...Search SV(M): Find movies and TV seasons
Open the sidebar menu and click Search to find titles in the SV(M) database. Back to User Guide Search by title or keyword Start typing the title of a movie or TV show in the search bar. Suggested results will populate automatically and narrow down ...Streamer Dashboards: Platform-level analysis
SV(M) tracks viewership for titles on top U.S. streaming services. Visit Streamer Dashboards to see details about key platforms, analyze combined viewing trends and compare top titles. Navigation Expand Streamers in the sidebar menu and choose a ...
Popular Articles
Quickstart Guide: Set up CONNECT in minutes
Whether you’re a new user or already have a Luminate account, here’s how to log in, access the CONNECT platform and start uncovering music insights. Back to Getting Started Quickstart steps If you already have a Luminate account for something else, ...Troubleshooting login and access issues
Locked out of your Luminate account? Can’t log in to CONNECT? Getting a mysterious error message? Our Support team can help — but first, try our troubleshooting tips. See below for common login problems and our recommended solutions. Back to Getting ...Troubleshooting guide: Quick fixes to common problems
If you’ve hit a CONNECT roadblock—access issues, error messages, apparent bugs—don’t despair! There could be a simple solution. Use this guide to narrow down the problem and/or make it easier to explain to Client Support. First, review our best ...Methodology 101: How Luminate collects, models and measures music data
Luminate tracks music consumption activity. We do this by ingesting reported activity from thousands of data sources. We use that data to construct and maintain a musical entity database. This allows us to attach metadata and activity to artists, ...Glossary: Acronyms, key terms and definitions
Key terms and acronyms used in CONNECT. Back to Terms and Concepts Back to How It Works A ATD Activity to Date Combined total activity, starting from the earliest year for which CONNECT has complete data and ending with the selected time frame. Read ...