Industry Analysis: Music market pulse
Industry Analysis aggregates music consumption data at the industry level for a broader view of streaming and sales performance. Use it to see big-picture trends or evaluate combined location, genre and provider data.
Navigation
Open Analysis and choose Industry.
Analysis KPIs
Industry Analysis leads with combined (market-wide) KPI highlights at the top of the page: Album or Stream Equivalent, Streams and Song Sales. A fourth KPI, Product Sales, is available in the U.S. and Canada.
These are aggregated industry-wide totals for your date range and location. Set a Breakout View to see splits for some categories. If you make a selection for Time Frame > Compare To, KPIs will also display a % increase or decrease.
These are aggregated industry-wide totals for your date range and location. Set a Breakout View to see splits for some categories. If you make a selection for Time Frame > Compare To, KPIs will also display a % increase or decrease.
Stream Equivalents treat 1 premium stream as the base unit of consumption; they’re applied worldwide and in countries for which we don’t track product sales data.
Equivalents allow us to convert and compare differently measured units. They help create a standard measure of music performance across a multi-format, multichannel landscape.
See Trends, Genres, Markets or Providers
Analysis opens on the TRENDS tab, which highlights combined weekly activity for your selected location and time frame. Switch to GENRES, MARKETS or PROVIDERS using the row of tabs at top left.

TRENDS
The Trends tab aggregates combined consumption by week. Below the KPI panes, Total Activity displays week-by-week trends for the entire industry in your selected location.
GENRES
The Genres tab sorts industry-wide consumption by genre.
Filter the genres you want to include by clicking the field to the right of the tabs; this opens the Genre pop-up menu.

Billboard and Luminate genres
Billboard and Luminate genre classifications are slightly different. Billboard genres match the Billboard chart categories.
Luminate genres are updated more often and include more subgenres for greater precision.
Read more: About Genre: How Luminate classifies music
Sample graph: Total Activity by Genre
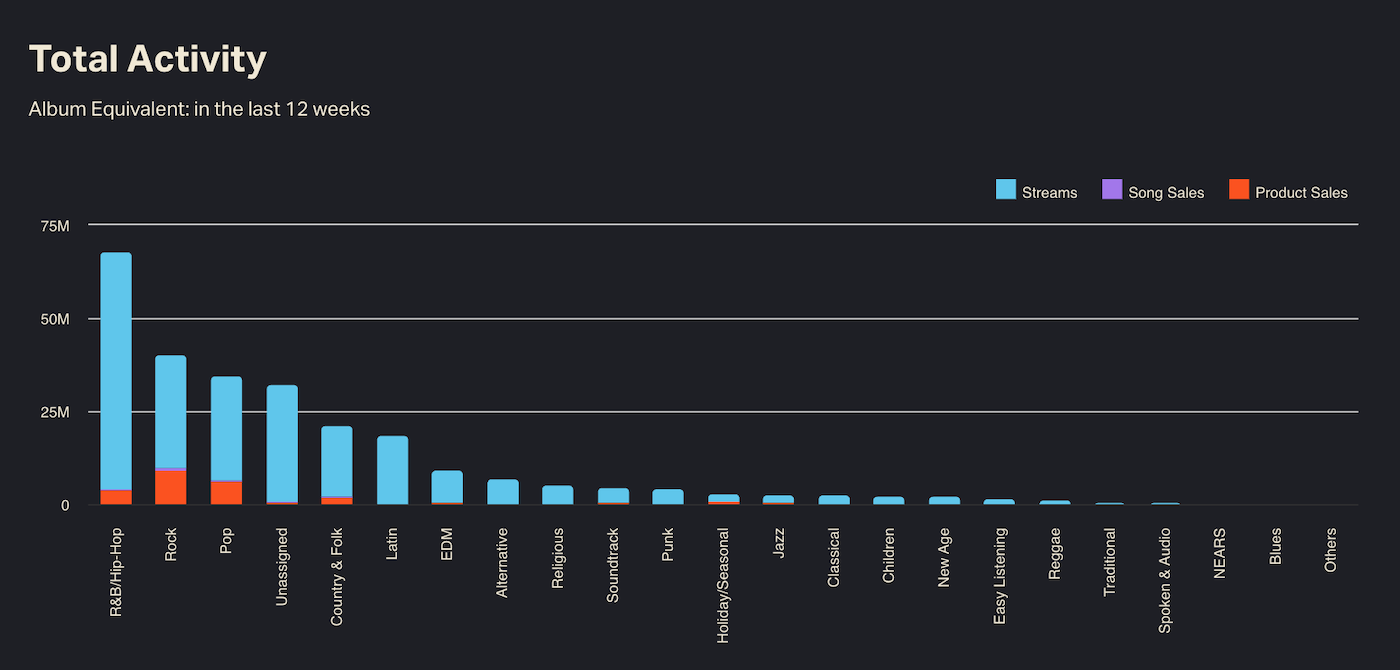 GENRES tab > Total Activity
Filter the genres you want to include by clicking the field to the right of the tabs; this opens the Genre pop-up menu.
Read more: About Genre: How Luminate classifies music
MARKETS
CONNECT tracks over 200 markets in the U.S. and over 70 in Canada.
Market area designations cover all of the U.S. and Canada. Every zip code is assigned to a market. Markets are labeled based on the nearest metro.
Market selection menuClick "United States / Canada Market," then select as many markets as you want to include.
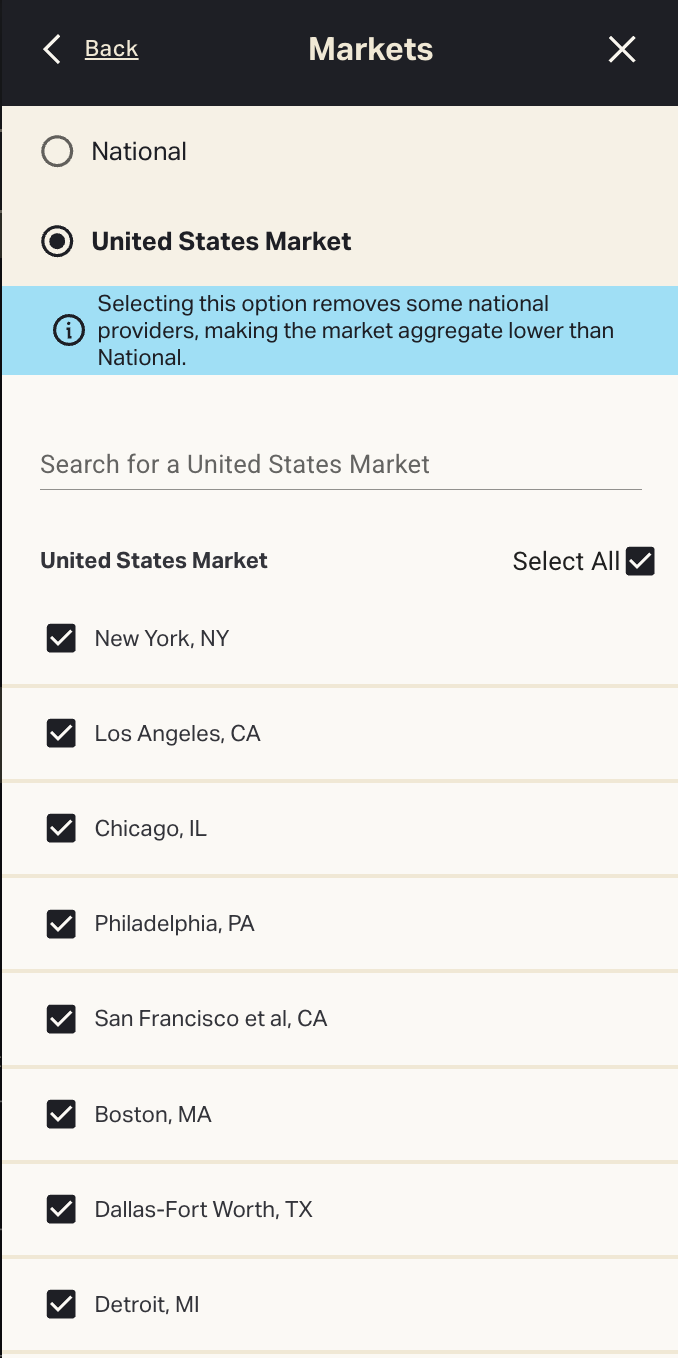
Search for markets by typing a few letters into the search bar.
Once you've selected markets to include, Total Activity appears as a list of markets sorted by consumption.
PROVIDERS
Providers comprise streaming DSPs as well as digital and physical retailers.
Set Time Frame and Location
Use the top menu bar to change Time Frame, Location and Markets. These settings apply across all Analysis tabs.
Time Frame
The Analysis Time Frame menu contains different options than you’ll find elsewhere in CONNECT. Click Time Frame in the top menu bar to open the calendar tool.
The shortest allowable timespan within Analysis is one week.
Compare To a previous time frame to see side-by-side data in Total Activity. Select Previous Period to see data for your selected period and an equal amount of time immediately preceding it.
Location / Markets
Change the location from the United States to a different country to see KPIs at the country level. Set Location:Worldwide to see combined international data.
Data Controls: All view options and filters
Open Data Controls to add more filters and detail to Industry Analysis.
Customize and export Analysis grids
Total Activity can be viewed in grid (table) format. Click JUMP TO GRID (top right) or scroll to the bottom of the page.
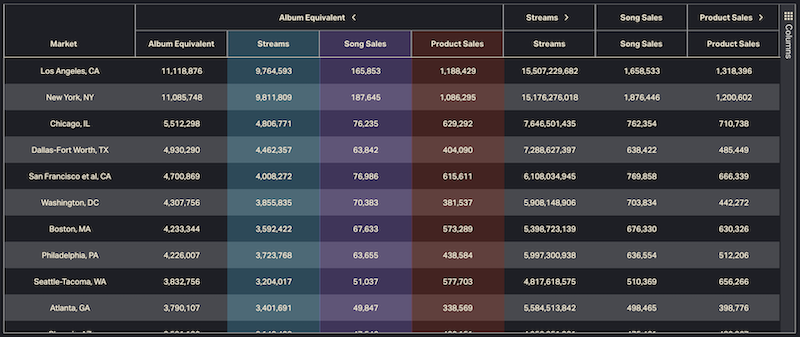 MARKETS tab > Activity grid
MARKETS tab > Activity grid
For example, a CSV export of U.S. Album Equivalent combined activity over the last 12 weeks, compared with the same period last year (SPLY), might look like this:
US_SPLY_PROVIDER_ALL_ACTIVITY_1728113122598.csv
Industry Analysis FAQs
What are Stream Equivalent and Album Equivalent?
The Analysis feature displays Stream Equivalent and Album Equivalent KPIs. Album Equivalents are used in the U.S. and Canada; Stream Equivalents are used worldwide and at the country level for all non-U.S. or Canada countries.
Read about Equivalents here.
Why are Time Frame options different in Analysis?
Analysis is designed to provide market-wide aggregate data, so Time Frame defaults to Last 12 Weeks. You can also choose Last Week, Year to Date, Last Quarter, Last 4 Quarters, Last Calendar Year or a custom (weekly) date range.
The shortest allowable date range in Analysis is one week.
Why can’t I select my own date(s)?
Analysis date spans can only be customized to the week, not the day. Select week numbers using the column to the left of the calendar.
What is Compare To? / What are the double bar graphs?
Within the Time Frame menu, you can Compare To a time period of equal length from the dropdown menu. There are two options: Last Period and Same Period Last Year.
Last Period is the span of time immediately preceding your selection. If you set your date range to Last 12 Weeks, Last Period = the 12 weeks before that.
Same Period Last Year is the same range, designated by week number, from last year. If you set a range of Weeks 1-4 of 2024, Same Period Last Year = Weeks 1-4 of 2023, even if the exact dates are not the same.
Choosing one of these options creates double bar graphs throughout Analysis. Each pair represents your date selection (right) and the comparison period (left).
Why does Analysis appear to change from week to week? / How do you process Analysis data?
Market-level data shown in Analysis is reprocessed back to the beginning of the last completed quarter.
CONNECT does not close the preceding quarter of Analysis data until the next quarter. We reprocess and refresh data for up to (almost) 2 quarters at a time. This means that) data pulled from the last 6 months might appear to be in flux, especially when viewing large quarterly totals.
Why did my Analysis bookmarks/saved Analysis URLs stop working?
Recent platform updates altered URL pathways across the Analysis feature. If you copied, saved or bookmarked URLs within Analysis, those links may be broken (sorry). Re-apply filters and Data Controls, then save the link again.
What does Release Age mean?
Release Age describes the age of a musical entity relative to the current date. We generally segment release ages into Current (released 0-18 months ago), Catalog (18-60 months) and Deep Catalog (60 months+).
Release Age cutoffs can be customized up to 72 months. Open the Release Age menu, then select a range or use the sliders to set your own.
Are Release Age “months” always the same number of days? What counts as the first and last day of a Current or Catalog span?
We calculate Release Age based on an average “month” of 30 days beginning with Day 0 (album release day). If Current is defined as 0-18 months, an album is considered Current from release date/Day 0 until Day 546. On Day 547 it flips to Catalog.
Are Release Ages fixed, or can they be relative?
Release Age is calculated relative to the date(s) you select. It is not based on today’s date.
Imagine that you time-traveled back to your selected date range. Now, some catalog music is new again for the purposes of your analysis.
Ex. To see industry-wide performance of music <18 months old back in 2021, set Time Frame to Weeks 1-52 of 2021. Set Release Age:Current and use the sliders to define Current:0-18 months. You’ll see combined activity for releases that were current in 2021. This includes releases from mid-2019 onward—all classified as Current within your parameters.
What if a title was Current for only part of my time frame?
In that case, we’d only include activity for the weeks when that title was still Current.
Release Age spans may begin or end within your selected time frame. A title “graduates” to the next Release Age bracket based on the number of days since its release date. If that happens during the timespan you set, it could be excluded (or finally included) per your filters.
In the above example, some 2019-2020 releases would be tracked for only part of 2021. Activity for a title from late 2019 could be included through early 2021; a title from mid-2020 might be dropped from the aggregate by the end of the year.
Are album Release Ages assigned at the Product, Release or Release Group level?
CONNECT assigns Release Age at the Product level. We track release dates by ICPN; each barcode we ingest carries its own release date information. Album reissues, expanded versions and alt editions can all have different release dates and different Release Ages.
Industry Analysis totals reflect this Release Age methodology. “Current” covers any Products released in the last 36 months (or within your custom span), including reissues or new editions of existing albums.
More to know
Methodology 101: How Luminate collects, models and measures music data
Equivalent weighting: Measuring music consumption
About Genres: How Luminate classifies music
Related Articles
Data Controls: Activity Types, Breakouts and filters
Dashboards generate dynamic charts, graphs and grids based on your selections for Location, Time Frame and Activity Type. These can always be set from the top menu bar. Beyond these three essential settings, CONNECT offers an array of tools to ...Sales data providers: List of U.S. and Canada active retailers
Go to Data Sources to see provider data availability directly in-app. CONNECT receives direct product sales data from thousands of retailers in the U.S. and Canada every day. We track physical and digital music sales across the retail spectrum, from ...Build a Ranking Report
Follow the steps below to generate a ranked list of up to 50,000 artists, songs or releases based on activity. Need more help? Check our main Report Builder FAQs. Back to Report Builder Back to User Guide Ranking Report steps From the CONNECT sidebar ...User Guide FAQs: Help with CONNECT features, tools and settings
How do I see ____? What's this menu? What does ____ mean? How do I change settings for ____? Our Support team hears every day from CONNECT users who want to get the most out of our self-service platform. We turned common questions into FAQs. The FAQs ...Streaming data providers: List of reporting DSPs
Go to Data Sources in CONNECT to see daily provider availability as a live grid. CONNECT ingests first-party consumption data from thousands of data sources worldwide, including all major U.S. and global digital service providers (DSPs). Reporting ...
Popular Articles
Quickstart Guide: Set up CONNECT in minutes
Whether you’re a new user or already have a Luminate account, here’s how to log in, access the CONNECT platform and start uncovering music insights. Back to Getting Started Quickstart steps If you already have a Luminate account for something else, ...Troubleshooting login and access issues
Locked out of your Luminate account? Can’t log in to CONNECT? Getting a mysterious error message? Our Support team can help — but first, try our troubleshooting tips. See below for common login problems and our recommended solutions. Back to Getting ...Troubleshooting guide: Quick fixes to common problems
If you’ve hit a CONNECT roadblock—access issues, error messages, apparent bugs—don’t despair! There could be a simple solution. Use this guide to narrow down the problem and/or make it easier to explain to Client Support. First, review our best ...Methodology 101: How Luminate collects, models and measures music data
Luminate tracks music consumption activity. We do this by ingesting reported activity from thousands of data sources. We use that data to construct and maintain a musical entity database. This allows us to attach metadata and activity to artists, ...Glossary: Acronyms, key terms and definitions
Key terms and acronyms used in CONNECT. Back to Terms and Concepts Back to How It Works A ATD Activity to Date Combined total activity, starting from the earliest year for which CONNECT has complete data and ending with the selected time frame. Read ...